Results 2
This batch of tests was run over the period 29/06/2013 onwards
Summary
A few things were discovered here:
1. The Genome appeared to age quickly
2. When we trained the genome against a window of most recent results, the histories needed refreshing as well
3. There was a bug in training, subtle but it meant results could be sub optimal, due an
unforeseen injection of randomness (this wasn’t fundamental, but incurred a penalty on achieving the best genome).
Result Data
The following graphs provide a view on the performance of the Predictor, verified by the witnesses. The results are up to date as of 02/07/2013.
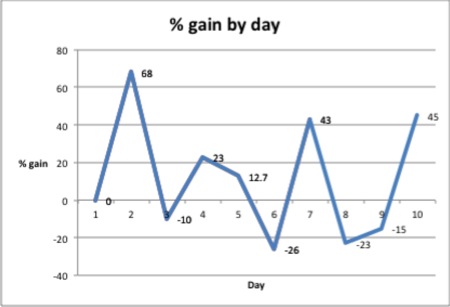
Day 1 is the start point, first predictor activity from Day 2 (29/06/2013).
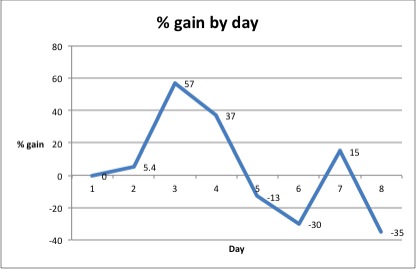
The above shows the percentage gain, per day, when betting as the predictor indicates.
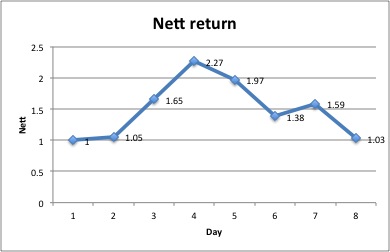
The above shows the aggregate gain, if the initial pot amount and subsequent gains are re-invested the next day.
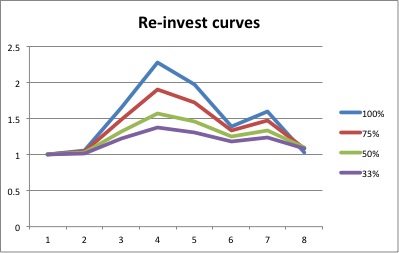
The above shows the aggregate gain , based upon different percentages of the pot being bet each day.
Results 3
This batch of tests continued from batch 2.
The sawtooth characteristic is curious. It’s as if when there is a bad day the genome learns, when its a good day it doesn’t and perhaps over-specialises… more work to do.
So, under the unproven theory that there is over-specialisation going on; when I retrained from day 13 I started from the low point at day 12. This has changed things, but it has started to tail off (but positive) from day 16.
Ok, so things have taken a dive again. In a light bulb moment (we shall see) it has struck me the fitness test for the GA element is wrong. To date the GA has been trained on generating as many first places as possible, but the reality is we are actually interested in the % return. So, overnight 29th July the training has changed to use a fitness function based on the return % gain. See Tests 4.
Result Data
The following graphs provide a view on the performance of the Predictor, verified by the witnesses. The results are up to date as of 28/07/2013.
Day 1 is the start point, first predictor activity from Day 2.
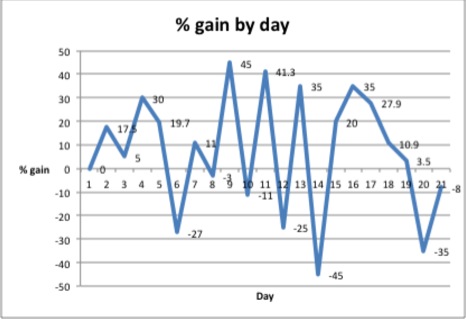
The above shows the percentage gain, per day, when betting as the predictor indicates.
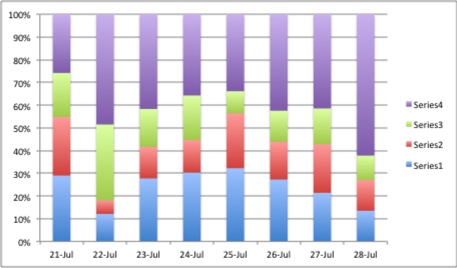
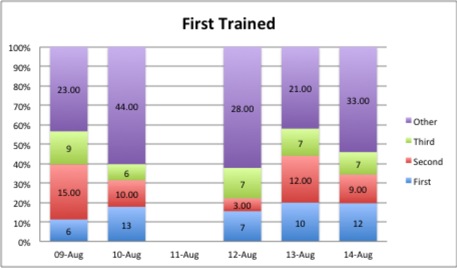
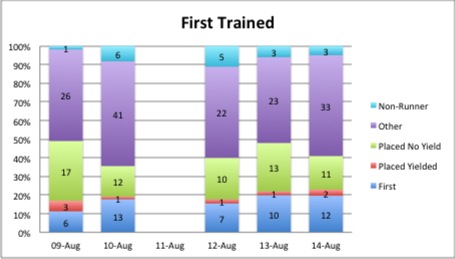
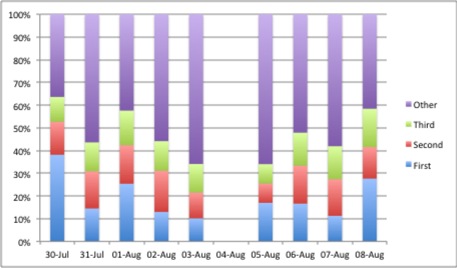
The above shows the distribution of the positions attained by the recommendations.
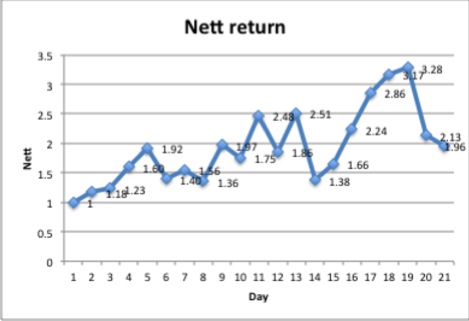
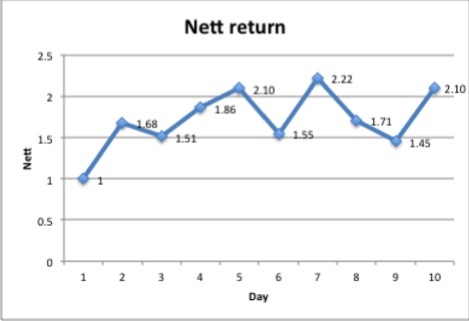
The above shows the aggregate gain, if the initial pot amount and subsequent gains are re-invested the next day.
Results 4
This batch of tests continued from batch 3. Under the new GA training regime outlined in the summary of Tests 3.
Result Data
The following graphs provide a view on the performance of the Predictor, verified by the witnesses. The results start from 30/07/2012..
Day 1 is the start point, first predictor activity from Day 2.
The above shows the percentage gain, per day, when betting as the predictor indicates.
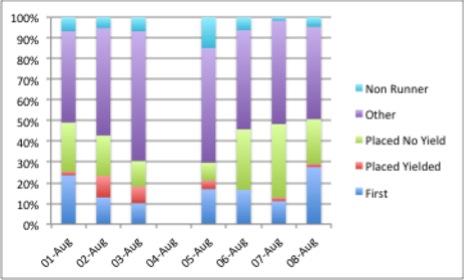
The above shows the distribution of the positions attained by the recommendations.
The above shows the aggregate gain, if the initial pot amount and subsequent gains are re-invested the next day.
Results 5
This batch of tests continued from batch 4.
Here we run the std Genome regime, as of 13th Aug the algorithm was adjusted.
Summary
The form of the overall solution is shown below:
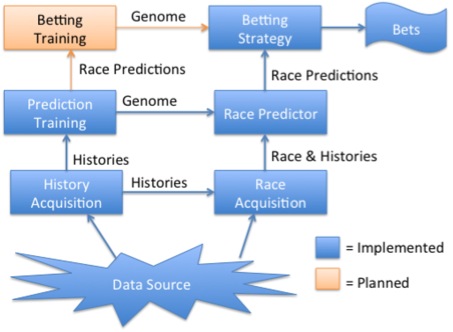
To date the Betting strategy has been a fixed “estimate”. Analysis of the raw race predictions has given rise to an alternate strategy, comparison of the two are recorded in tests 6. The premise is that the underlying genome is providing some good predictions , but the Betting strategy element is having an adverse impact.
Result Data
The following graphs provide a view on the performance of the Predictor, verified by the witnesses. The results start from 08/08/2012..
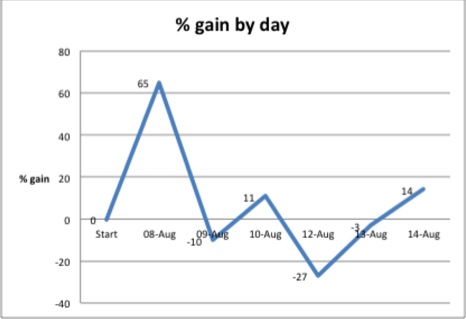
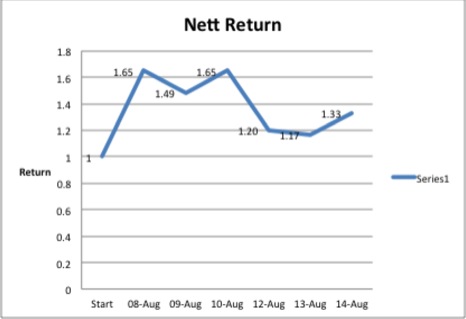
The above shows the percentage gain and nett gain per day for each strategy.
Below are the detailed breakdown.